Jews and Israel 2024 Survey: Ten Further Insights

By Robert Brym
May 30, 2024

“Jews and Israel 2024: A Survey of Canadian Attitudes and Jewish Perceptions,” published in the spring 2024 volume of Canadian Jewish Studies / Études juives canadiennes, attracted considerable attention, particularly in Canada’s Jewish community. Some readers of my report on the survey asked follow-up questions that seem to me to be of sufficiently general interest to require answers in a public forum such as this.

Below I list ten questions that I find especially intriguing. Each question is followed by my reply, based mainly on secondary analysis of the 2024 data. In the following, where I write that a finding is “significant,” I mean that there is at least a 95 percent chance that it will be found in nineteen of twenty similar samples, so the finding is likely to reflect the situation in the population from which the relevant sample is drawn.

Do you know anything about how much and which kinds of media respondents have been consuming?

I collected data on media consumption for non-Jews only. I asked, “How often do you listen to, watch, or read about news happening outside North America?” Respondents could answer “never,” “less than weekly,” “weekly,” “daily,” or they could not respond. I followed up with the question, “How often do you listen to, watch, or read about news events happening outside of North America from each of the following sources?” A list of eleven news sources followed: the Globe and Mail (print or online); the National Post (print or online); CBC (TV or online); CTV (TV or online); CNN (TV or online); Fox News (TV or online); TVA (TV or online); Le Devoir (print or online); La Presse (print or online); social media (Facebook, X [formerly Twitter], Instagram, TikTok, etc.); and talking with friends or family. For each of these options, respondents could answer “never,” “less than weekly,” “weekly,” “daily,” or they could not respond. Respondents could select as many news sources as they deemed relevant.

If we define people who are well-informed about news outside North America as those who consume such news daily, then among the three non-Jewish samples (members of the general adult population, university students, and adult Muslims) we find significant differences. By the preceding definition, the best informed Canadians are those in the general adult population, 64 percent of whom consume such news daily. At 52 percent, Muslims are significantly less well informed by my definition. By far the least well-informed respondents are university students, just 20 percent of whom say they consume international news daily.

As is well known, social media are designed to feed people information that reinforces pre-existing opinions. The predominant use of social media for access to international news therefore augurs poorly for the existence of a well-informed public that is not highly divided. According to the 2024 survey, social media are by far the most frequently consumed daily news sources for 60 percent of Muslims and 45 percent of university students. In both cases, the second most frequently consulted source of international news—34 percent for Muslims, 24 percent for university students—is “friends or family,” also sources that are more likely to reinforce than challenge pre-existing opinions. For the general population, the “echo chamber” phenomenon is less widespread; social media and the CBC are tied for the most popular daily news source at 35 percent, with “friends or family” next at 24 percent. For all three samples, print media are the least popular type of news source. No more than 10 percent of each sample say they read any source of print news daily. All these differences are significant.

Do Muslim attitudes toward Jews vary by age or level of education? 

In Canada, Muslim attitudes towards Jews are not significantly associated with age or educational attainment. That is, the attitudes of younger Muslims are no more negative or positive toward Jews than are the attitudes of older Muslins. Similarly, Muslim attitudes toward Israel are not significantly associated with educational attainment. Muslims with relatively little formal education are not more or less likely than those with university degrees to have negative attitudes toward Jews. Attitudes toward Israel are, however, associated with age: younger Muslims have significantly more negative attitudes toward Israel than do older Muslims.

For non-Jews in the general population and among university students, can you provide a breakdown of attitudes toward Jews and Israel by racialization?

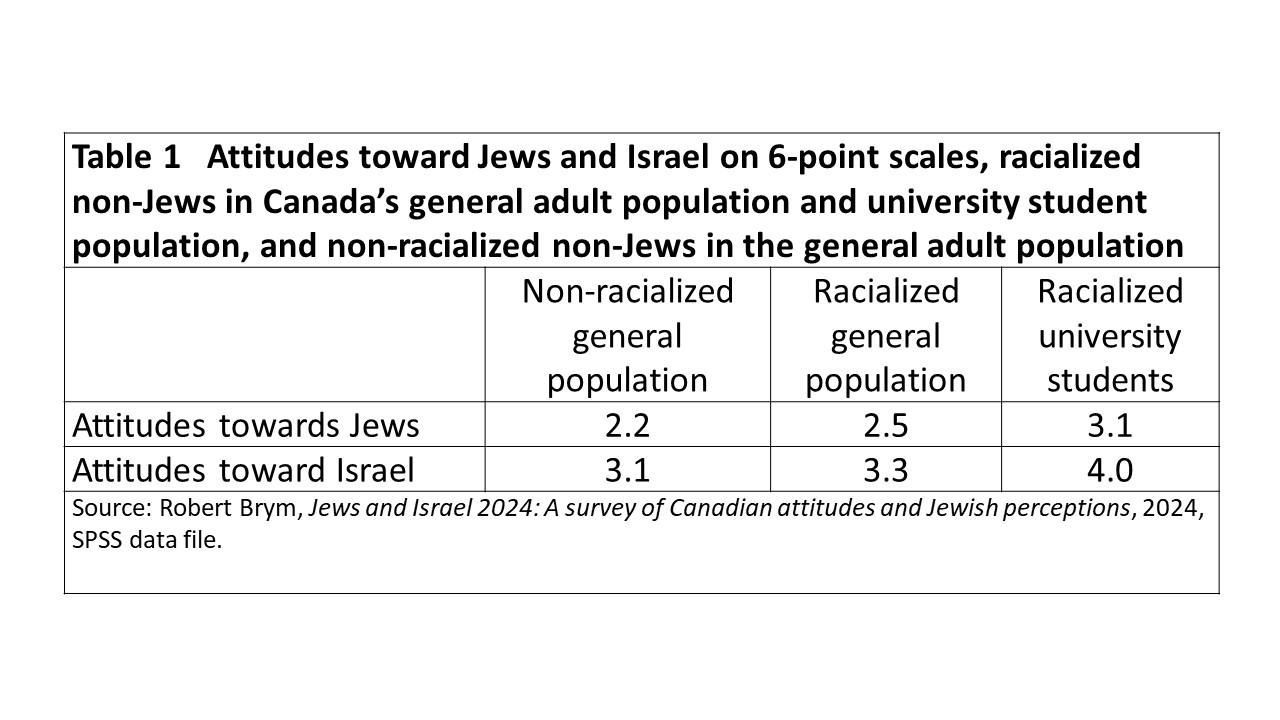
I can, but I must lump together Indigenous, Caribbean, Latin American, Black African, Arab, and other Asian Canadians to keep the numbers large enough to yield meaningful results. The table below summarizes the results of this exercise.[1] It places each of the relevant samples on six-point scales of attitudes toward Jews and toward Israel. The construction of these scale is discussed in detail in the source cited in endnote 1. Higher scores indicate more negative attitudes.

Table 1 shows that the racialized adult population has significantly more negative attitudes toward Jews and toward Israel than does the non-racialized adult population. In turn, racialized university students are significantly more likely than racialized members of the population as a whole to have negative attitudes toward Jews and toward Israel. The latter pattern holds even if I remove Arabs from the racialized university student sample (not shown here). Only Muslim Canadians have more negative attitudes toward Jews and toward Israel than do racialized university students.[2]

You found that non-Jewish university students have significantly more negative attitudes toward Jews and toward Israel than does the general non-Jewish population. Does this difference exist because the percentage of Muslim students in the university population is larger than the percentage of Muslims in the general population?

Canada’s Muslim population is relatively young, so the percentage of Muslim students attending university is larger than the percentage of Muslims in the adult population at large. However, when I remove Muslims from the two samples, non-Jewish university students still have significantly more negative attitudes toward Jews and especially toward Israel than do members of the general non-Jewish population. 

I’m curious what you make of the fact that, in terms of raw numbers, there seem to be more antisemites in Canada than Jews. Do you know of any study that tries to assess what proportion of a population needs to be antisemitic for actual violence or legal persecution to take hold—a kind of numerical tipping point?

There are about 315,000 Jews over the age of seventeen in Canada. The “Jews and Israel 2024” survey found that 3 percent of non-Jewish Canadian adults (about one million individuals) are in the top one-sixth of the scale measuring negative attitudes toward Jews. Based on these figures it is plausible to claim that highly antisemitic adults outnumber Jewish adults by roughly three to one in this country.

I don’t know of any study that tries to assess how large the proportion of antisemites needs to be for violence or legal persecution of Jews to take place. I hypothesize that the proportion of antisemites in a country influences the level of violence against Jews but not their legal persecution. I surmise that, in the latter case, control of state structures plays the most important role.[3]

My reasoning regarding violence is based on the following consideration. Anti-Defamation League surveys show that the percentage of antisemites is higher in France than in the US and higher in the US than in Canada.[4] My impression is that, of these three countries, France has the highest level of violence against Jews and Canada the lowest. These findings suggest that the larger the proportion of antisemites, the more violence against Jews.

As far as legal persecution is concerned, control of state structures, not the proportion of antisemites, seems to be decisive. Consider that during World War II, the proportion of antisemites was relatively low in the Netherlands and relatively high in Romania, but the Netherlands was much more effective than Romania rounding up Jews and sending them to their death. Why? Because the Nazis took over the existing public bureaucracy to identify, assemble, and ship Jews to the death camps, and the public bureaucracy was much more efficient in the Netherlands than in Romania.[5] Or try this thought experiment: Imagine two countries in which, say, 40 percent of the population are antisemites. In country A (call it Israel including the Occupied Territories today) there is no legal persecution of Jews. To the contrary, Jews have rights that non-Jews lack. In country B (call it Germany in 1944) the highest imaginable level of legal persecution of Jews is evident. Here we have two countries with the same proportion of antisemites but vastly different levels of legal persecution of Jews. In both cases, the decisive circumstance influencing the level of legal persecution of Jews is control of state structures, not the proportion of antisemites. As Lenin said in 1921, the important question is Кто кого?—Who [dominates] whom?

How if at all has the Israel-Hamas war affected the pattern of Jewish support for federal political parties?

The pattern of Jewish support for federal political parties changed after October 7, 2023. I can’t say definitively that the change is due to the Israel-Hamas war because none of the surveys of Jewish Canadians I’ve been involved with asked questions about why respondents support one party or another. Nonetheless, the timing and magnitude of the change suggest that the varying reaction of different Canadian political parties to the Israel-Hamas war is largely responsible for the shift in Jewish voting patterns.

Traditionally, more Jews have voted for the Liberal Party federally than for any other party. This tendency was evident in the results of the 2018 Survey of Jews in Canada, which showed that Jewish support for the Liberals was 5 percentage points higher than support for the Conservatives (Table 2). Five years later, in August-September 2023, a survey sponsored by New Israel Fund Canada, JSpace Canada, and Canadian Friends of Peace Now found that the Liberal Party still commanded the support of a plurality of Jewish voters, leading the Conservatives by 4 percentage points.[6]

However, the “Jews and Israel 2024” survey discovered an abrupt change in Jewish voting intentions. While Liberal Party support eroded by 4 percentage points between 2018 and 2023, it dropped an additional 7 percentage points in the five to six months between August-September 2023 and February 2024. In what may be an historic first, a plurality of Canadian Jews in early 2024 said they would vote for the Conservative Party if a federal election were held tomorrow. Support for the Liberals was still significantly higher among Jews than non-Jews, but support for the Conservatives was at the same level among Jews and non-Jews.

Circumstantial evidence suggests that the observed shift in Jewish voting patterns in 2024 is largely associated with the different approaches to the Israel-Hamas war taken by the Liberal and Conservative Parties. The Liberal Party condemned Hamas unequivocally for the October 7 pogrom but froze new arms exports to Israel until it could be certain that the weapons were being used in accordance with Canadian law. In contrast, the Conservative Party leadership offered unambiguous support for Israel alone, denouncing the Liberals for what the latter regarded as a more balanced approach. In my judgment, the contrasting Liberal and Conservative positions on the Israel-Hamas war were the main factors leading to the sudden large drop in Liberal Party support among Jewish voters in 2024. 

Can you provide more details about the degree of attachment of Jews to Israel—specifically, breakdowns of attachment by age, political persuasion, and region? 

In my report on the 2024 survey I noted a significant decline in emotional attachment to Israel among Canadian Jews in 2024—possibly the result, I argued, of policies proposed and enacted by the most right-wing government in Israel’s history and its conduct in the Israel-Hamas war.

Examining the percentage of Canadian Jews who say they are very emotionally attached to Israel, we see that in 2024 there were sharp divisions by region, Canadian political party support, and age cohort. Specifically, 39 percent of Jewish adults in Quebec and 38 percent in Ontario say they are “very” emotionally attached to Israel, but in the rest of the country, where Jews tend to be more assimilated and the rate of intermarriage is higher than in Montreal and Toronto, the figure is significantly lower at 25 percent.

There is also a clear left-right gradient among Jews who are very emotionally attached to Israel. Fifty-three percent of Jewish supporters of the Conservative party say they are very emotionally attached to Israel, compared to 29 percent of Jewish Liberal Party supporters and 19 percent of Jewish supporters of the New Democratic Party.

In what may portend future developments, members of younger age cohorts tend to be significantly less likely to be very emotionally attached to Israel than are members of older age cohorts. While 41 percent of Canadian Jews over the age of 64 say they are very emotionally attached to Israel, the figure for eighteen-to-thirty-four-year-olds is 29 percent, 12 percentage points lower. The demographer Sergio DellaPergola recently examined the structure of Jewish attitudes concerning what it means to be a Jew in nine countries, including Canada.[7] He found that Israel occupies a central place in the attitudinal structure of Jews in all countries apart from the US. The 2024 data on Canadian Jews’ emotional attachment to Israel hint that, in a few decades, the Americans may have company.

What percentage of Canadian Jews are Zionists?

I didn’t ask Jewish respondents directly if they self-identified as Zionists. However, I did ask, “Do you believe Israel has the right to exist as a Jewish state?” I believe that a positive reply to this question indicates that the respondent is a Zionist. I found that 91 percent of Canadian Jews believe Israel has the right to exist as a Jewish state, 6 percent say they don’t know, and 3 percent said that Israel does not have the right to exist as a Jewish state.[8]

How confident are you that findings from the “Jews and Israel 2024” survey are reliable?

This is a very important question. The answer is a bit technical.

In statistical terms, reliability refers to consistency of measurement. The measures in survey Z are 100 percent reliable if they produce the same findings as the measures in previous identical surveys A, B, and so on.

In practice, the measures of no survey are 100 percent reliable. However, findings from surveys based on samples that reflect population characteristics reasonably well are reliable within calculable margins of error. Margins of error are specified in the report on the “Jews and Israel 2024” survey.

Margins of error can be calculated if the characteristics of a sample closely reflect the characteristics of the population from which the sample is drawn. Probability samples, in which the chance of drawing each respondent from the population is known, offer a high level of accuracy. A random sample is the simplest type of probability sample; each respondent in a random sample has an identical chance of being selected from the population.

Drawing a probability sample of a so-called rare population, such as Canadian Jews, who comprise only about 1 percent of Canada’s population, is extremely expensive. For instance, if one wanted to create a random sample of five hundred Canadian Jews for a landline/cell phone survey, and 5 percent of calls resulted in a person agreeing to be interviewed, it would be necessary to make one million calls to find five hundred Jewish respondents. (One hundred calls would be required to find five respondents, two thousand calls to find one Jewish respondent, and one million calls to find five hundred Jewish respondents.) At, say, $1 per call, that’s a million dollars.

Non-probability samples, such as the samples on which the “Jews and Israel 2024” survey is based, produce less reliable findings than do probability samples but they are much less expensive.[9] Respondents invited to participate in the 2024 survey were drawn from a large panel consisting of tens of thousands of individuals who had previously agreed to participate in surveys in exchange for payment. The cost of drawing four sample of 1,121 non-Jewish adults, 1,010 non-Jewish university students, 312 Muslim adults, and 414 Jewish adults for the 2024 panel-based survey was about 3 percent of the estimated cost of sampling a random sample of five hundred Jews.  

A researcher can be assured that a non-probability sample resembles the population from which it is drawn by (1) weighting the sample so it matches key population characteristics as measured in, say, a recent census and (2) examining the sample to see whether its key characteristics are similar to those of other recent samples of the population in question. I followed these procedures in the “Jews and Israel 2024” survey. For example, I weighted each sample by the age, gender, and province of residence of its population as found in the 2021 census. I weighted some samples by additional population characteristics known from census data.

I also compared key features of the samples with the results of recent surveys. For instance, I knew from previous research that the political orientation of respondents would necessarily colour their responses to a range of questions asked in the survey. Accordingly, I compared non-Jewish respondents’ federal voting intentions with those revealed by an Abacus Data poll based on a large probability sample of more than two thousand Canadian adults and conducted in the same month that the “Jews and Israel 2024” survey was in the field. I found almost identical results for voting intentions in the two surveys.

Similarly, I knew from previous research that whether Jewish respondents say they identify as Jews religiously or only ethnically or culturally would have a bearing on how they respond to many questions in the survey. I therefore compared the percentage of these two features of Jewish identity with results from the large 2018 Survey of Jews in Canada—a tough test because the 2018 survey used an entirely different method to sample Jews. Nonetheless, I found almost identical results after taking into account that the percentage of Canadian Jews identifying as Jewish by religion declined 1.7 percent between 2011 and 2021 and extrapolating that trend to 2024.[10]

These procedures increased my confidence that the samples in the “Jews and Israel 2024” survey reflect reasonably well the characteristics of the populations from which they are drawn. I therefore conclude that the calculation of margins of error for the findings is justified.

To finally answer the question, I can’t be entirely confident that findings from the “Jews and Israel 2024” survey are reliable, but I’m pretty sure they are reliable within known margins of error.     

How can it be true simultaneously that, for non-Jewish university students, (1) levels of both anti-Jewish and anti-Israel sentiment are higher than the average for the non-Jewish population as a whole and (2) the correlation between these two sets of sentiments is low? Doesn’t the low correlation (r=0.165) imply that the levels of both anti-Jewish and anti-Israel sentiment are also low?

Correlations and averages are different. The correlation tells us how much or how little knowing the sentiment of an individual non-Jewish student toward Jews tells us about that student’s sentiment toward Israel (or vice versa). Specifically, the low correlation found in the survey says that knowing a student’s sentiment toward Jews tells us very little about that student’s sentiment toward Israel (and, again, vice versa).

In contrast, the average tells us the level of sentiment toward Jews or Israel for the entire group. High average group levels may be associated with low correlations at the individual level.

This is in fact the case for Canada’s non-Jewish university students. In Figure 1, each black dot represents a non-Jewish university student who responded to the survey questions about Jews and Israel. A straight horizontal line separates (1) students whose attitudes toward Jews are more negative than the national average for non-Jews in the general population (above the horizontal) from (2) students whose attitudes toward Jews are more positive than the national average for non-Jews in the general population (below the horizontal). A straight vertical line separates (1) students whose attitudes toward Israel are more negative than the national average for non-Jews in the general population (to the right of the vertical) from (2) students whose attitudes toward Israel are more positive than the national average for non-Jews in the general population (to the left of the vertical).

Fully 50 percent of Figure 1’s black dots are in the pink, upper right rectangle. This means that one-half of non-Jewish university students have attitudes toward Jews and toward Israel that are more negative than the average for the non-Jewish population as a whole. In short, the levels of anti-Jewish and anti-Israel sentiment among non-Jewish university students are high relative to the attitudes of the general non-Jewish population. However, the correlation between the two attitudes remains low because, for individual students, one attitude can’t predict the other attitude well.


Notes

[1] Respondents were allowed to specify multiple ethnic, geographical or cultural identities. Table 1 is based only on their first choices.

[2] A similar situation exists for young Black and Hispanic Americans in the US. Eitan Hersh and Laura Royden, “Antisemitic Attitudes Among Young Black and Hispanic Americans,” Journal of Race, Ethnicity, and Politics 8, no. 1 (2023): 105-23.

[3] Another relevant factor influencing the rate of violence might be the proportion of Jews in the population. Compare research conducted in the 1960s and 1970s on the relationship between frequency of lynching and percent Black in the counties of various southern US states from the 1890s to the 1930s. The research shows that a larger proportion of Blacks was perceived as more threatening than a smaller proportion and therefore led to more anti-Black violence. The tipping point that led to the rate of lynching more than doubling was reached when the Black population of a county reached about 60 percent. Hubert M. Blalock, Toward a Theory of Minority-Group Relations (New York: Wiley, 1967); John Shelton Reed, “Percent Black and Lynching: A Test of Blalock’s Theory,” Social Forces 50, no. 3 (1972): 356-60.

[4] Anti-Defamation League, “2019 Survey Update,” 2020, https://tinyurl.com/4w6p5cux; Anti-Defamation League, “The State of Antisemitism in America 2020,” 2021, https://tinyurl.com/372r6k3z.

[5] Zygmunt Bauman, Modernity and the Holocaust (Ithaca NY: Cornell University Press, 1989).

[6] Additional findings from the August-September 2023 poll are in Robert Brym, “Canada’s Jewish Population, 2023: Focus on Minorities and Attitudes toward Israel’s New Government,” in American Jewish Year Book 2023, eds. Arnold Dashefsky and Ira M Sheskin (Cham, Switzerland: Springer, 2024).

[7] Sergio DellaPergola, “Jewish Demography and Identity in Nine Countries,” in The Ever-Dying People? Canada’s Jews in Comparative Perspective, eds., Robert Brym and Randal F. Schnoor (Toronto: University of Toronto Press) 249-66.

[8] The last figure was incorrectly reported as 4 percent in Brym, “Jews and Israel 2024,”, 78, fn 81.

[9] For a thorough and insightful discussion of nonprobability sampling of Jewish populations, see L. Daniel Staetsky, “Can Convenience Samples be Trusted? Lessons from the Survey of Jews in Europe, 2012,” Contemporary Jewry 39, no. 1 (2019): 115-153.

[10] Robert Brym, “Counting Canada’s Jews in the Era of Secularization,” Canadian Jewish Studies / Études juives canadiennes (forthcoming).